
Visualization
NucPosViewer is a visualization tool for the output of NucPosSimulator. NucPosViewer is written in Java and provided as system-independent executable jar-Archive (please visit the Download-page). Launch the program by double-clicking the jar-Archive. Alternatively, you can launch the viewer from command line:
$ java -jar NucPosViewer.jar
To run the program, a current version of Java Runtime Environment (JRE v1.6 or higher) must be installed on your system.
Quick Start
NucPosViewer visualizes the results of a simulation run from NucPosSimulator. The tool displays the
nucleosome occupancy contained in the
*.bed.occupancy
-file and the simulation snapshots contained in the
*.bed.sim
-file. Both files have to be located in the same folder as your
input
*.bed
-file. To visualize a simulation run select a
*.bed
-file in the Open dialog (
File > Open ...
). The according supporting files will be loaded automatically.
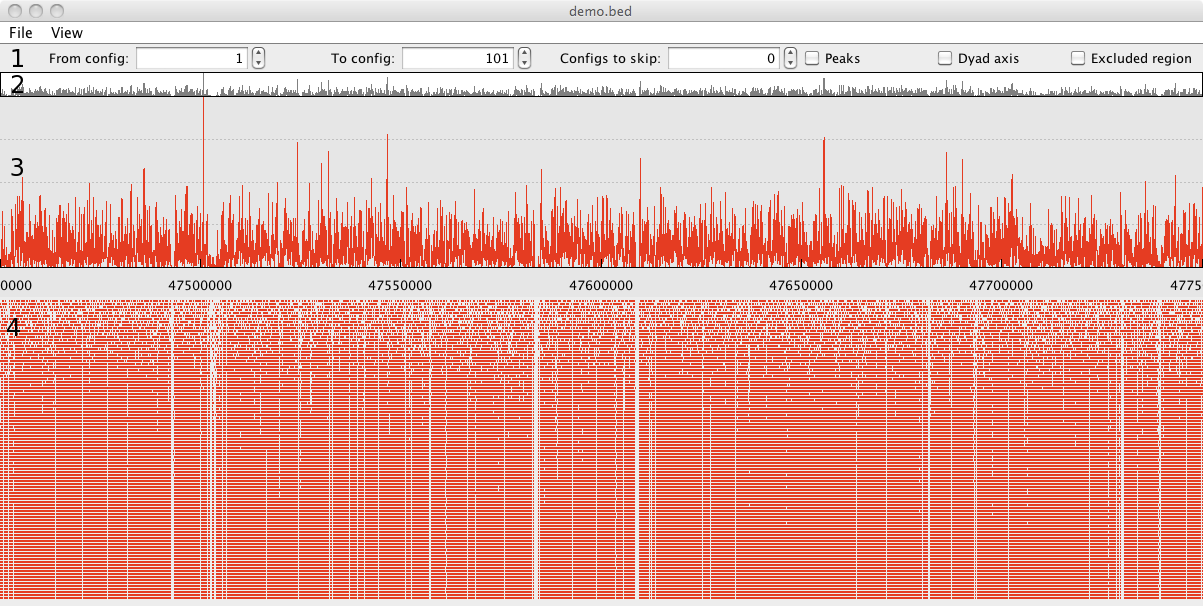
1 - Control panel with different visualization options.
2 - Overview of the nucleosome occupancy for the whole locus.
3 - Nucleosome occupancy in detail for a selected part of the locus.
4 - Visualization of the simulation run. One simulation
snapshot is displayed as row of red bars, and represents a locus
with nucleosomes at a certain time point of the simulation.
Nucleosomes are represented by red bars, the linker DNA between
nucleosomes is not illustrated explicitly. In case the locus is
large and the run contains many simulation snapshots this plot can
be very crowded. If so, it is convenient to select parts of the
simulation with the options
From config
,
To config
and
Configs to skip
.
Navigation
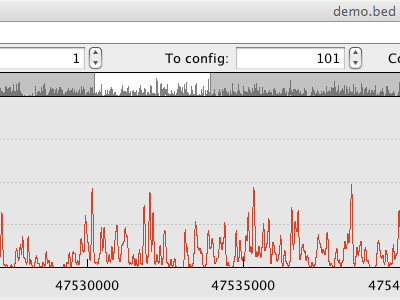
You can use the overview and detailed occupancy plots to
navigate within the locus. By dragging the mouse with pressed mouse
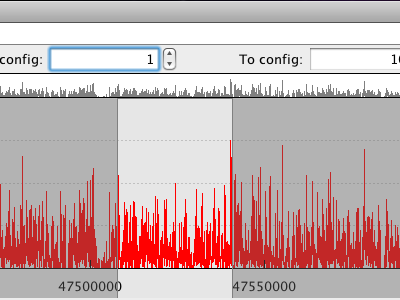
button you can shift the selected locus region. If the
Ctrl-key is pressed additionally while mouse drag is performed (or Cmd, if you work on Mac OS X),
you can change the selected area. To select only a part of the
simulation data you can use the options From config,
To config and Configs to skip,
see also Visualization Options.
- Mouse movement with pressed mouse button - Shift of the selected region.
- Mouse movement with pressed mouse button +
Ctrl- Alter the selection.
The selection can be reset via the menu (
View > Auto adjust
).
 |
Selection via the overview occupancy plot. |
 |
Selection via the detailed occupancy plot. |
Visualization Options
| Option | Description |
|---|---|
From config |
First simulation snapshot from the simulation run that is visualized. Default is 0. |
To config |
Last simulation snapshot from simulation run that is visualized. Default is the last snapshot of the simulation run. |
Configs to skip |
Number of simulation snapshots that are skipped in the visualization. If the value is 0 every simulation snapshot is shown, if the value is 1 every second is selected. |
Window size |
Size of the viewport in kbp. To change the size
of the viewport enter the new value and press Enter |
|
Items in the View menu: |
Peaks |
Shows the position of peaks in the input nucleosome occupancy in the simulation results as lines. |
Dyad axis |
Displays the dyad axis of nucleosomes in
the simulation results as green line. This is option is useful in
combination with option Peaks
|
Excluded region |
Displays the region, that is occupied by
one nucleosome in light red. Note, this region is only displayed,
in case parameter NucLength in the simulation was
greater than the generic 147 bp.
|